Introduction
As part of my volunteer role as Data & Insights Officer at Penny Brohn UK, I carried out a mapping project to investigate how the charity’s services are used. I gathered the dataset from the charity’s CRM and explored it using Excel and Tableau.
I produced the slide deck below to explain and visualise my findings.
And I received the following feedback for my work:
“Thank you so much for this really interesting presentation, it provides some valuable insights and food for thought .. including understanding all the data gaps!” - Nicky, Head of Services at Penny Brohn UK
“This looks fantastic thank you so much! It’s really interesting to see the patterns that emerge here and how that might shape what we do going forward.” - Helen, Services Administrator and Customer Relations Assistant at Penny Brohn UK
Reflection
I made this slide deck very early on in my Tableau learning journey; since then I have gained significant experience and am now confident in building dashboards and creating higher quality data visualisations. Given the opportunity, I hope to undertake another similar project for the charity, and next time I will endeavour to create a better user experience through improved Tableau visualisations.
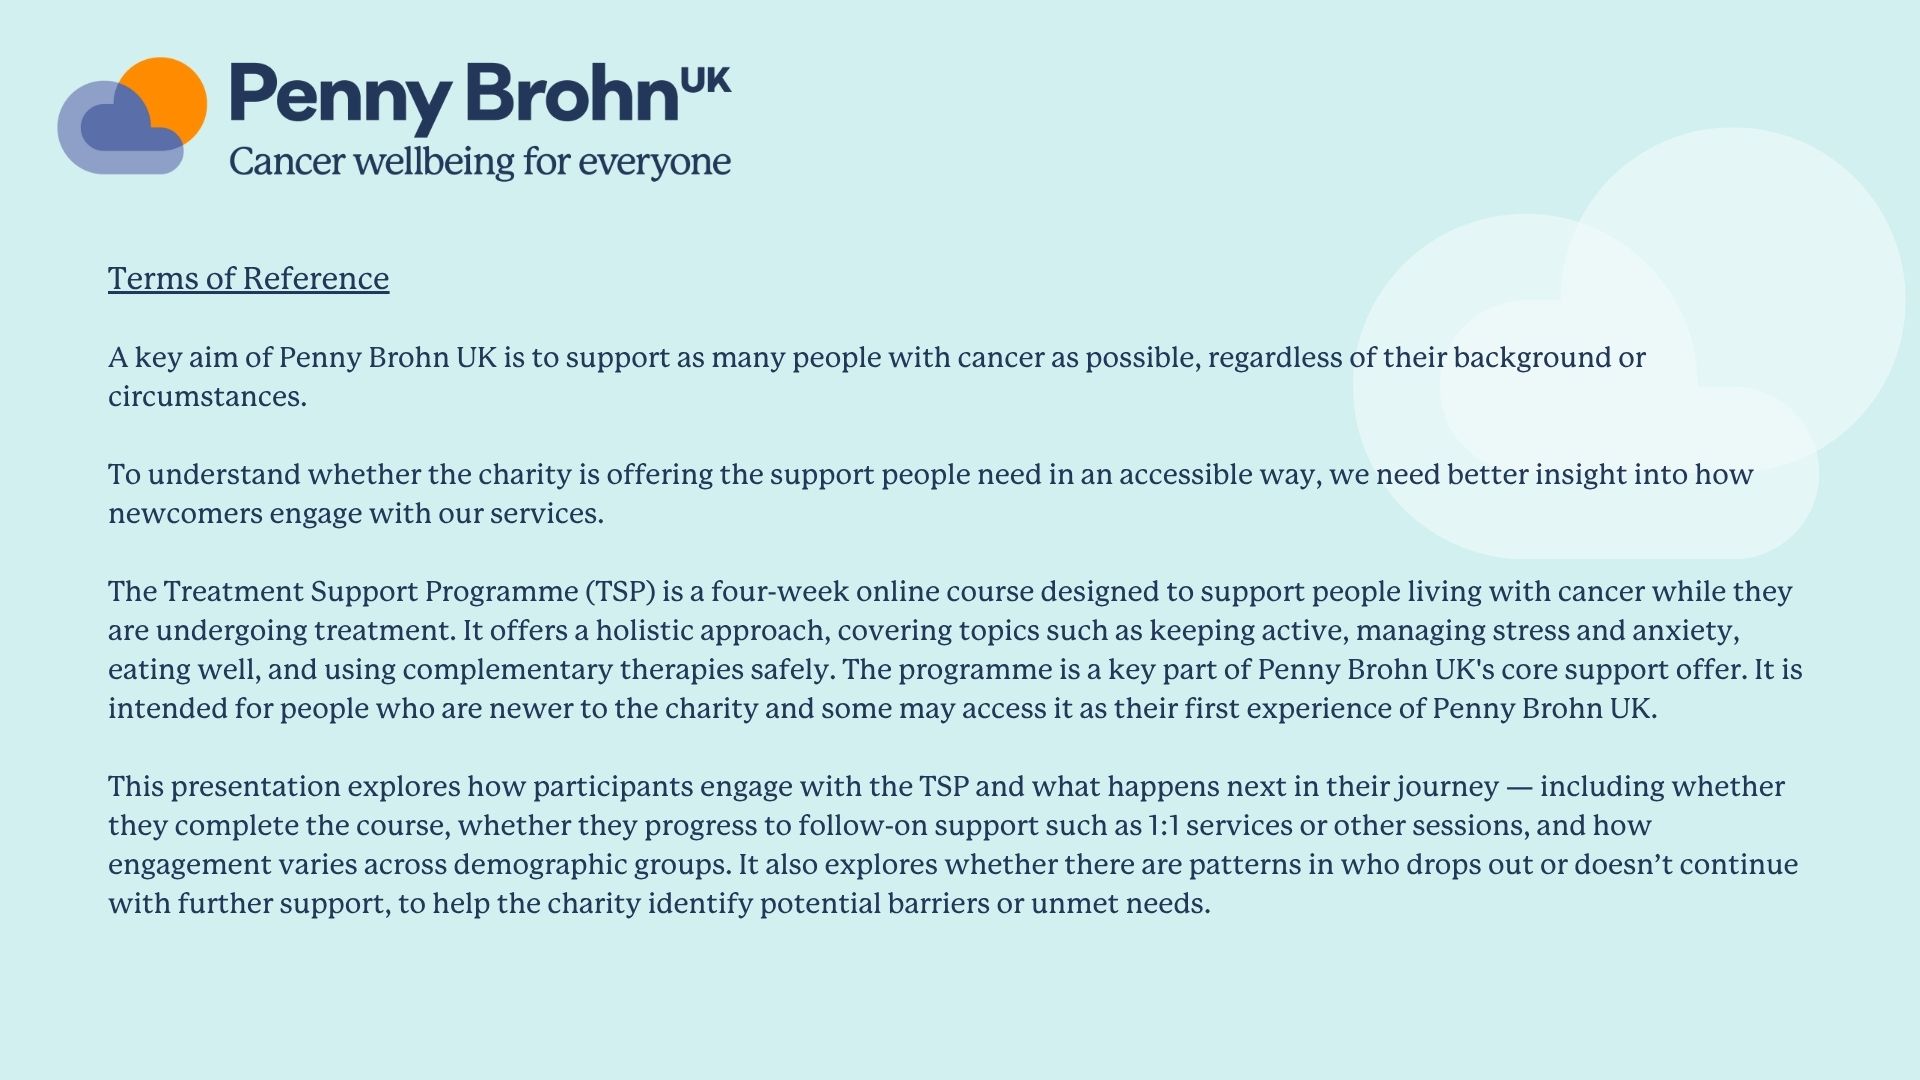
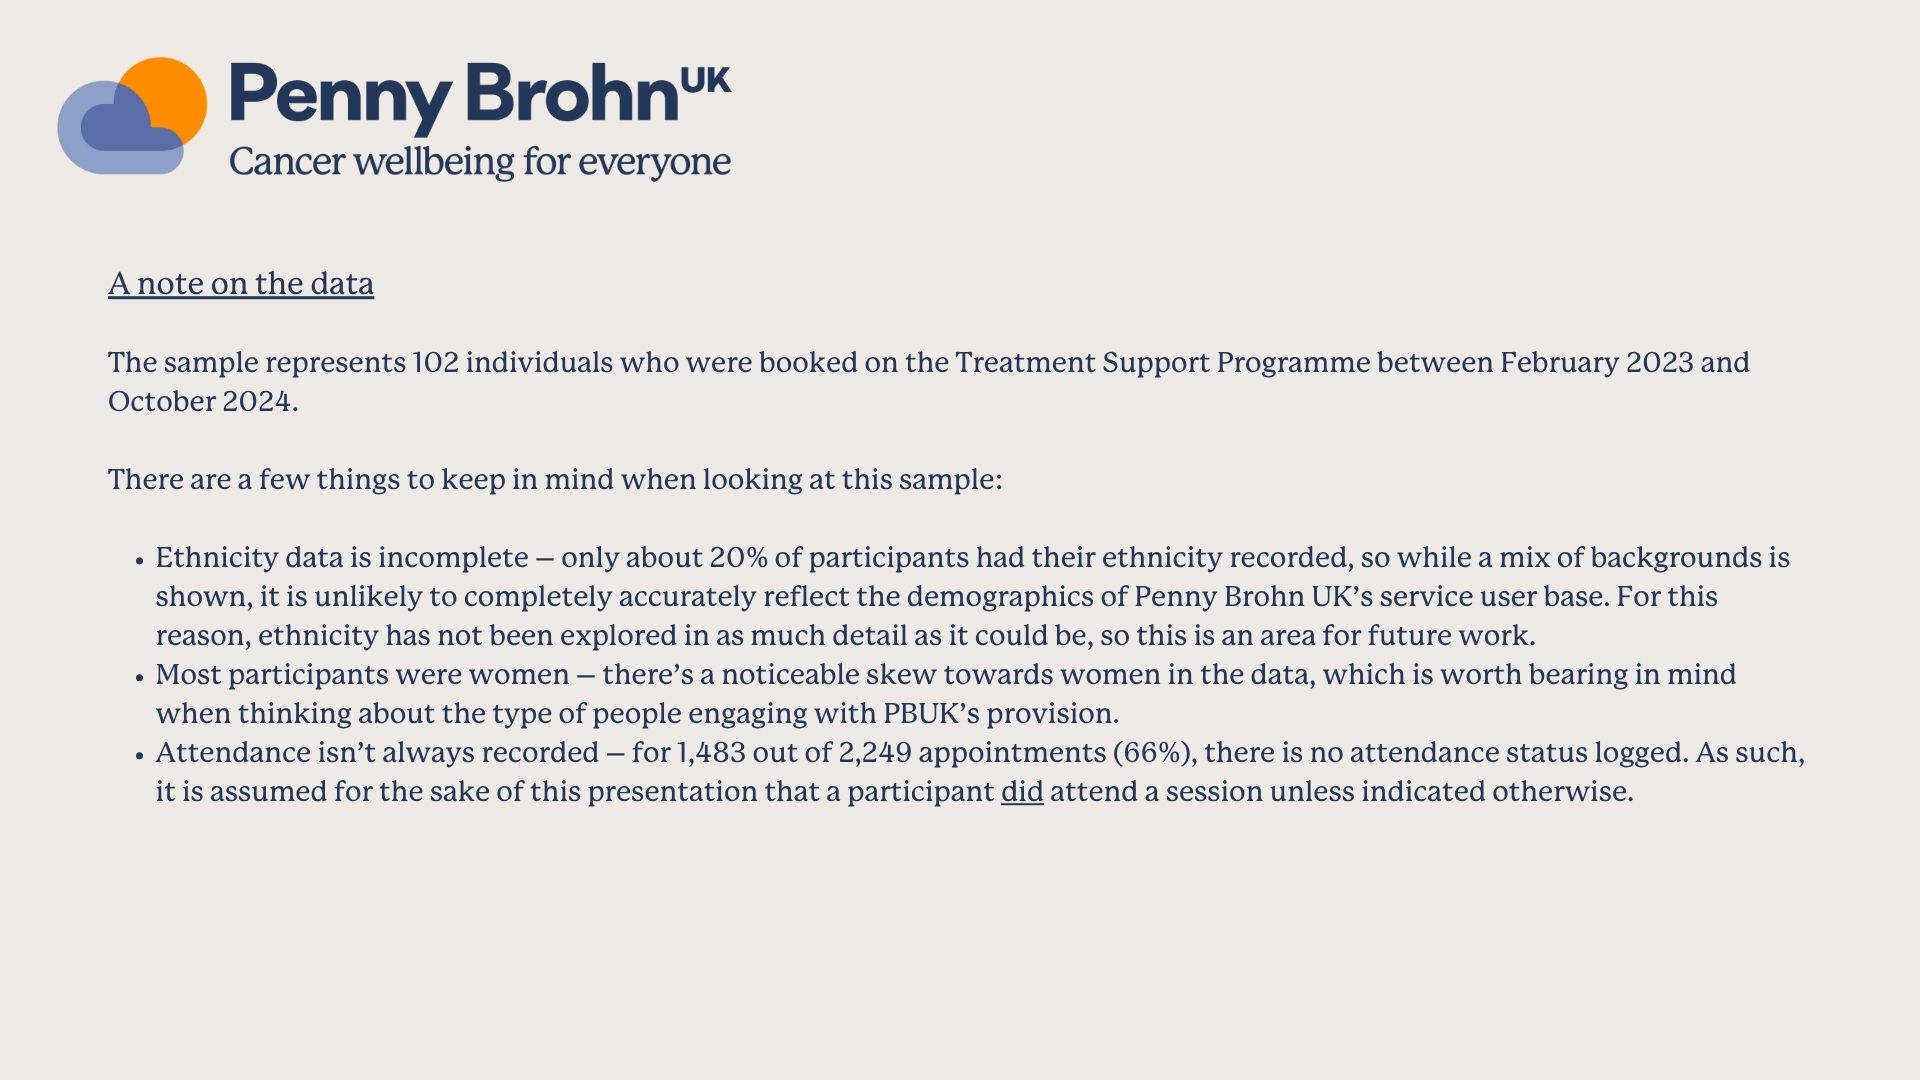
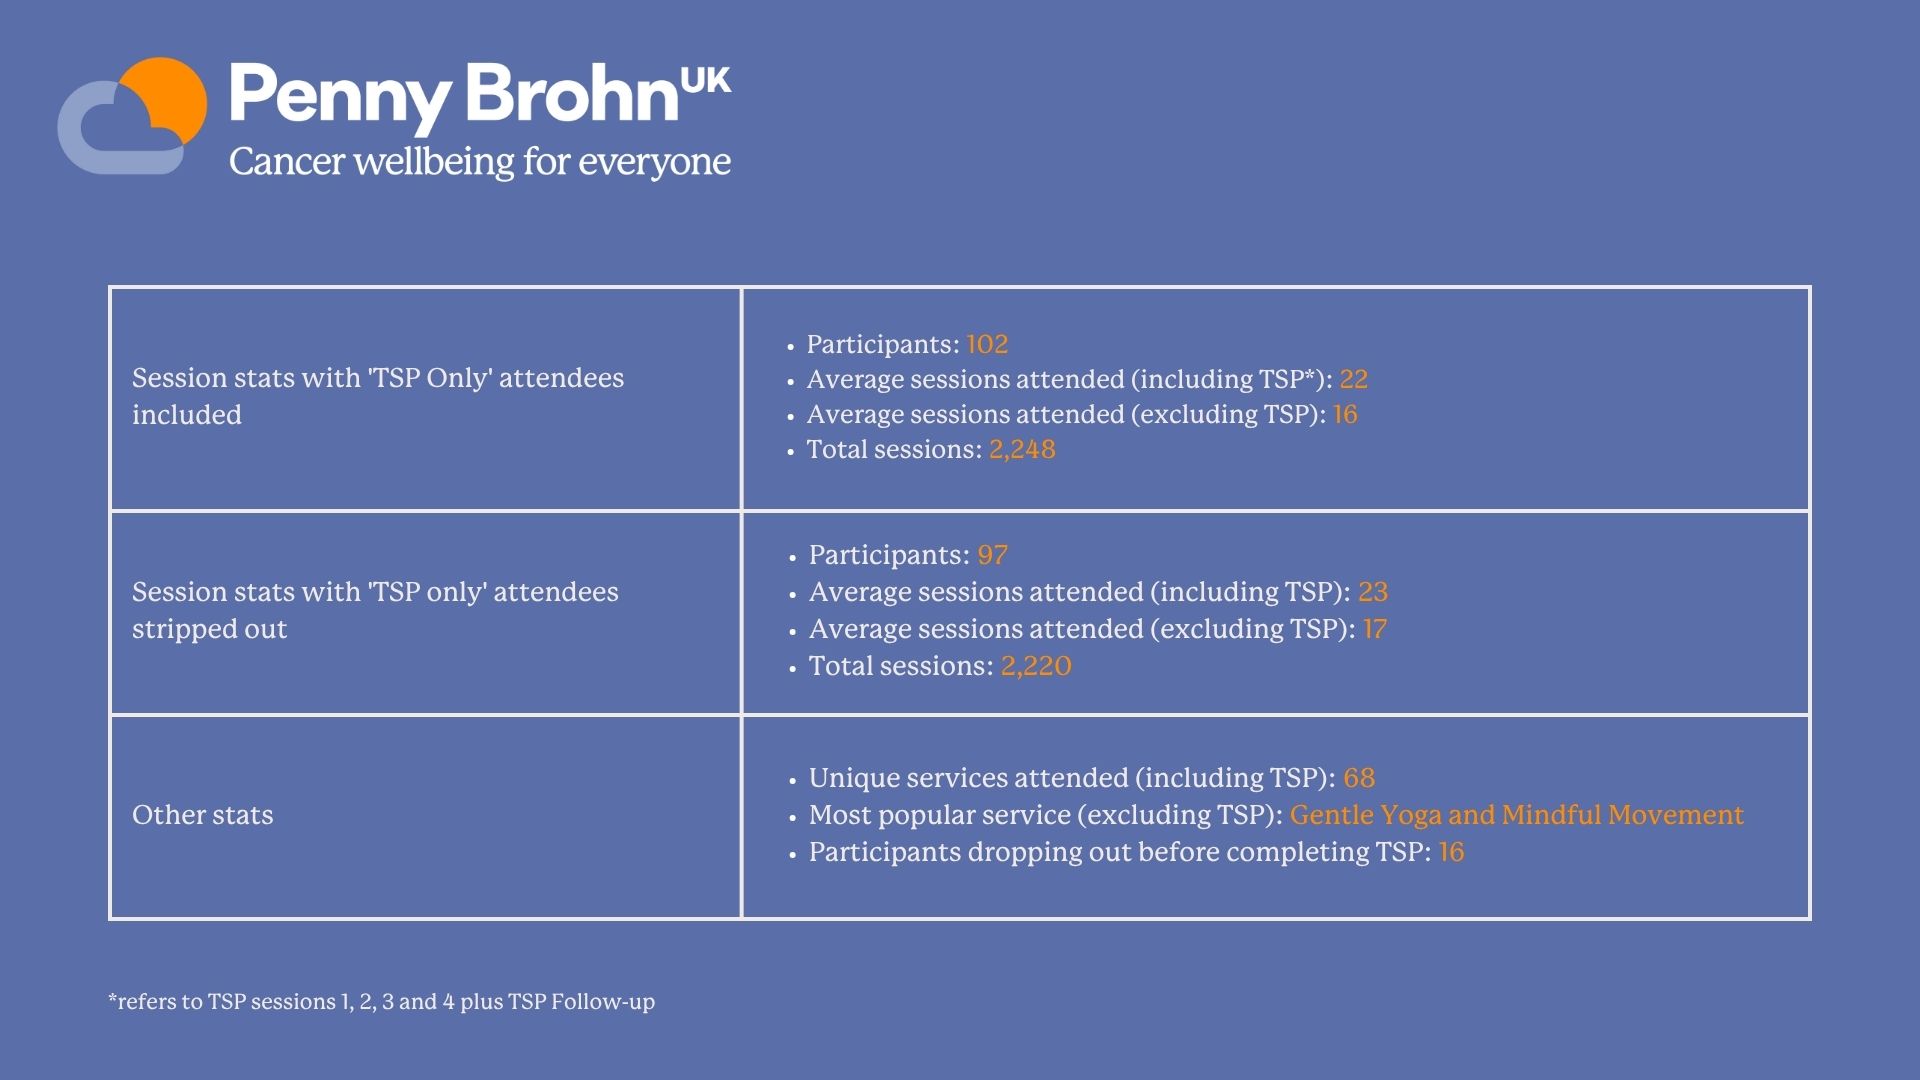
Presentation