Worst. Analysis. Ever: An Exploration of Simpsons Episodes in R
data analysis
tidy tuesday
r
doh
Author
Liam Cottrell
Published
February 4, 2025
Intro
I have officially undertaken my first data analysis project - looking at some Simpsons data for #TidyTuesday. I’ve been learning R for a grand total of two weeks so this is not particularly ✨ excellent ✨ (Mr Burns voice) but we all start somewhere!
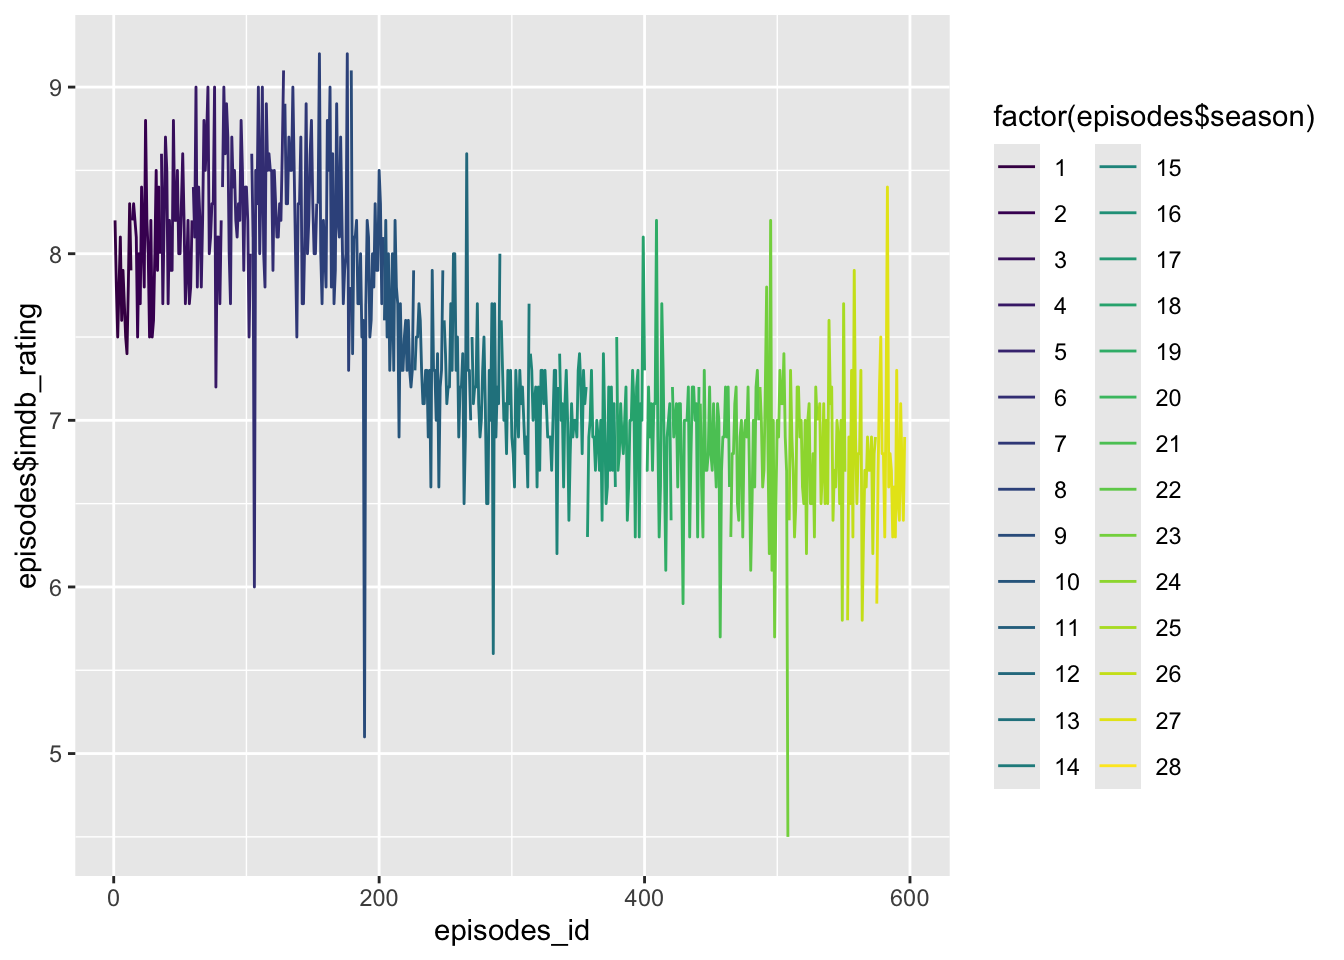
Season 23’s Lisa Goes Gaga, with just 4.5/10, is the lowest rated episode.
IMDb ratings over time
# plot ratings over time by season ggplot(episodes, aes(x = episodes_id, y = episodes$imdb_rating, color =factor(episodes$season))) +geom_line() +scale_color_viridis_d()
Warning: Removed 3 rows containing missing values or values outside the scale range
(`geom_line()`).
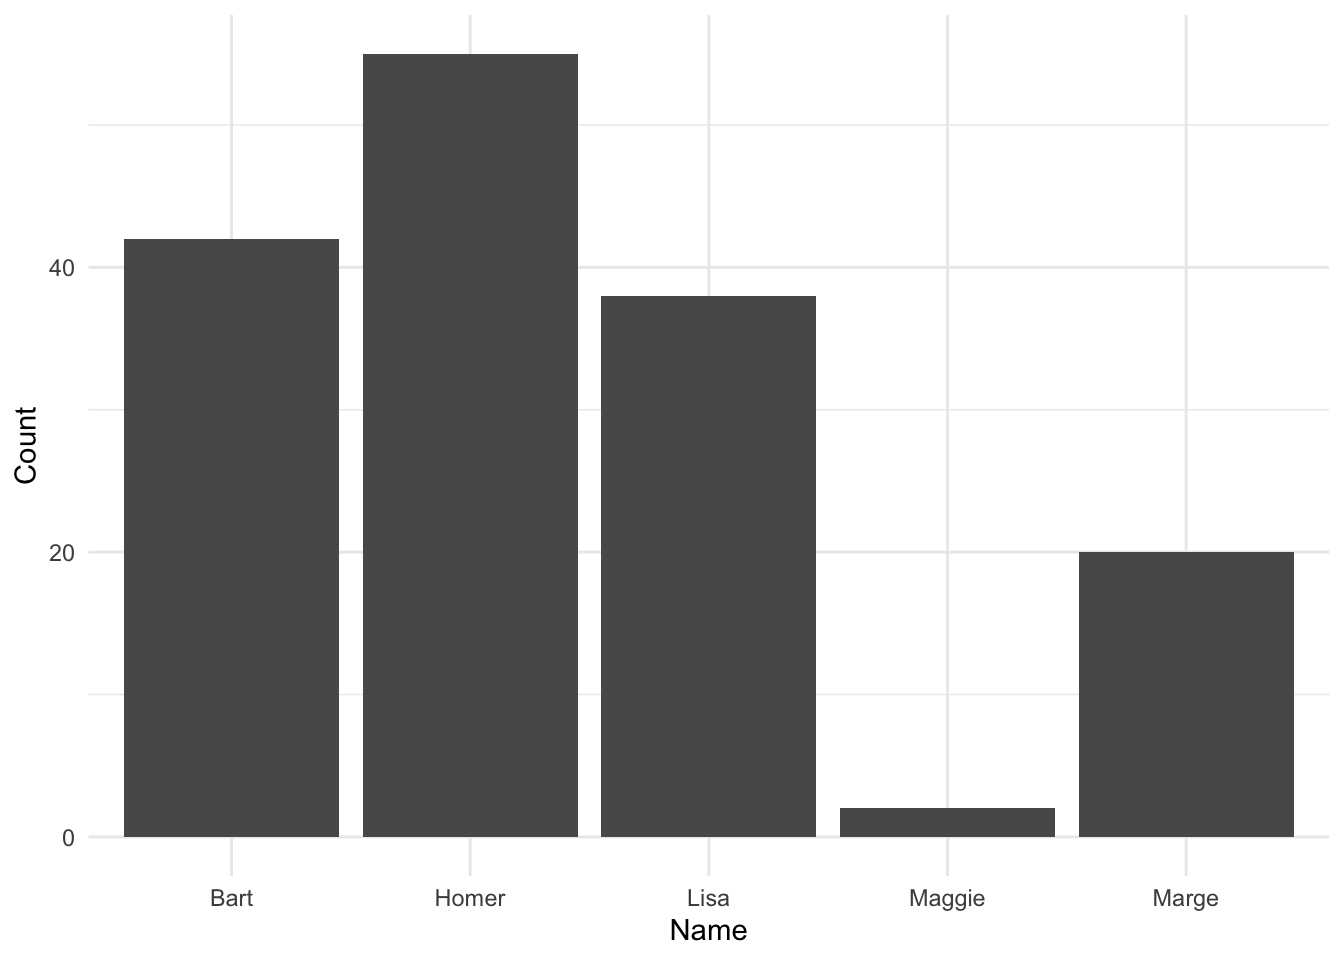
# visualise frequency of character names appearing in episode titlesggplot(name_freq, aes(x = Name, y = Count)) +geom_bar(stat ="identity") +theme_minimal()